Data Visualization Projects in Python with Plotly and Seaborn

This is a curated collection of Guided Projects for aspiring data scientists, data analysts, and anyone who is interested in both data visualization and dashboarding. This collection will help you get familiar with exploratory data analysis and visualization of datasets like Box Office, using Python libraries like Plotly and Seaborn.

You’ll start by analyzing Box Office data using Plotly and Seaborn, and then you’ll explore the data visualization capabilities of Plotly Express. You’ll see how to use these 2 libraries for exploratory data analysis (EDA), feature engineering, as well as statistical data visualization.

This collection is suitable even if you have never used Plotly and Seaborn before. Through step-by-step guidance from a subject matter expert, you will become comfortable using these libraries to generate interactive, publication-quality graphs and data analysis. Prior experience in Python programming is highly recommended.

Data storytelling is one of the trending job skills in Coursera's 2020 Global Skills Index (GSI). Download the 2020 edition of the GSI reportOpens in a new tab.

Why is data visualization important?

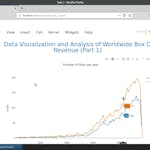
Producing visualizations is an important first step in exploring and analyzing real-world data sets. Data visualization is a key component of any data scientist's toolbox. It is also a powerful way to identify problems in analyses and illustrate results.

Are Plotly and Seaborn the right tools for me?

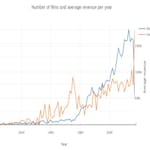
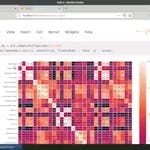
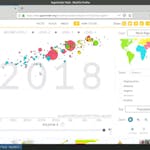
Many tools are needed to accomplish the variety of visualizations you can create using Python. Seaborn and Plotly focus on data exploration through rapid iteration. They support a wide range of visualizations including financial, statistical, geographic use-cases and even advanced three-dimensional use-cases. Both Seaborn and Plotly integrate with Jupyter widgets, making it possible to display plots in Jupyter notebooks and update them in-place after they are created. They have really rich documentation to integrate with Jupyter Notebooks and JupyterLab -- one of the most widely used tools by the data science and machine learning community.

What is a Guided Project?

A Guided Project helps you learn a job-relevant skill in under 2 hours through an interactive experience with step-by-step instructions from a subject matter expert. Everything you need to complete a Guided Project is available right in your browser. No software or prior experience is required to get started.

Popular Categories on Coursera: BusinessOpens in a new tab | Computer Science Opens in a new tab| Data Science Opens in a new tab| Information TechnologyOpens in a new tab | HealthOpens in a new tab | Career SuccessOpens in a new tab | Free CoursesOpens in a new tab | Guided ProjectsOpens in a new tab | See AllOpens in a new tab

Popular Degrees on Coursera: Business DegreesOpens in a new tab | Computer Science DegreesOpens in a new tab | Data Science DegreesOpens in a new tab | Public Health DegreesOpens in a new tab | Bachelor’s DegreesOpens in a new tab | Master’s DegreesOpens in a new tab | See all online degrees on CourseraOpens in a new tab

Popular Professional Certificates on Coursera: Google IT Support CertificateOpens in a new tab | IBM Full Stack Development CertificateOpens in a new tab | Facebook Social Media Marketing CertificateOpens in a new tab | See all professional certificates on CourseraOpens in a new tab

Popular MasterTrack Certificates on Coursera: Social Work: Practice, Policy, and Research CertificateOpens in a new tab | Instructional Design CertificateOpens in a new tab | Machine Learning for Analytics CertificateOpens in a new tab | See all MasterTrack certificates on CourseraOpens in a new tab

CommunityJoin a community of over 100 million learners from around the world
CertificateLearn from more than 200 leading universities and industry educators.
Confidence70% of all learners who have stated a career goal and completed a course report outcomes such as gaining confidence, improving work performance, or selecting a new career path.
All courses include:
  • 100% online
  • Flexible schedule
  • Mobile learning
  • Videos and readings from professors at world-renowned universities and industry leaders
  • Practice quizzes

Can’t decide what is right for you?

Try the full learning experience for most courses free for 7 days.

Register to learn with Coursera’s community of 87 million learners around the world